Mike Medved
-
Posts
1,534 -
Joined
-
Last visited
-
Days Won
123
Content Type
Profiles
Forums
Blogs
Gallery
Downloads
Events
Everything posted by Mike Medved
-
Add Decimal(s) display setting to Chart Vertical Scale
Mike Medved replied to MrMunchkin's question in Feature Requests
Done will be in next beta. -
Yes - click and drag on the bottom horizontal axis. Click and drag on the vertical axis. Or right click on the vertical axis for more precise adjustments. We make it simple for you
-
Ok - first, on the portfolio, if you don't already have #BCPT.ETH in it, hit Ins key and type it in and hit Enter to add it. Once it is in the portfolio's list of symbols, make sure your Start button is pressed and Binance is selected as the Source.

-
The symbol (according to our symbology rules) in MT should be: #BCPT.ETH - I checked it with Binance and it works. https://www.medvedtrader.com/trader/WebHelp/index.html?symbology.htm
-
If you in settings add negative % to Fibonacci numbers and turn them on in the retracements, you will get extensions.
-
We got it. It is quite complex actually, because of the cloudflare issues. Gotta hook it up in MT. It's on the todo list
-
Ok - in simple mode you cannot do that. Just no prepared variable to simply compare it. In advanced mode (and let's say 1-min chart mode), you create a state object of type FIFOQueue of size 24*60, and add to it the close of the current candle, then call the GetHighLow function to find the high and the low for the last 24*60 minutes. And of course, to check if it is within 2% of the low in the 24 hr range you would check if (Close-Low24)/(High24-Low24)<=0.02 If you don't think you can do it yourself, I'll throw it together and post it here.
-
What's a "24 low"? Within 2% or less of what?
-
If you have a formula or an algorithm for it, it is definitely possible. Point us to it and we'll see about putting it in (or helping you code it in scans).
-
Hiding B. Bands doesn't hide the center line
Mike Medved replied to ehjump's topic in Bug Reporting - Public
Thanks for the report. Will be fixed in next beta. -
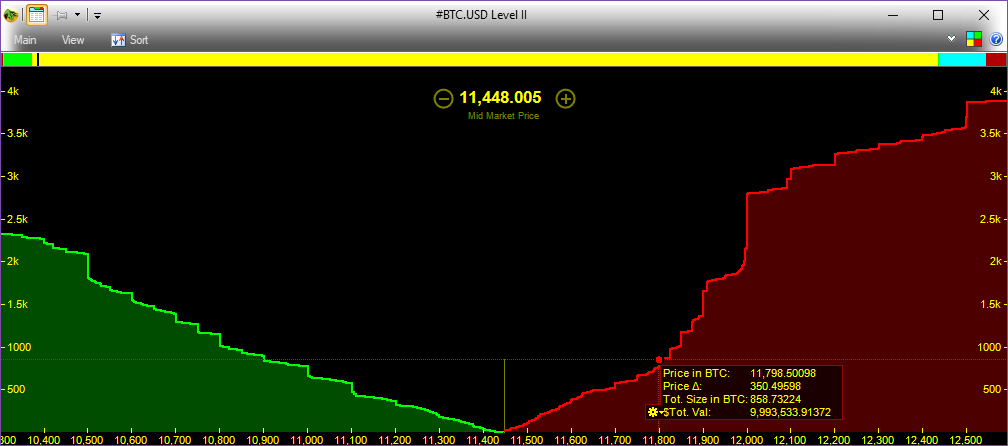
GDAX and Binance for now. Others will be added if their API permits. Working on making a Depth Chart (we like to call it Canyon Chart) in MT. Here's a sneak preview.

-
Problem with Discord (if I understand what Discord is) is that it is a live chat. We really don't have time to sit in the live chat, unfortunately. Someone has to program all these nifty new features.
-
... and market holidays for it.
-
I started a Medved Trade subreddit: https://www.reddit.com/r/MedvedTrader/ Feel free to post. And subscribe
-
Mix timeframe in formula
Mike Medved replied to stephane's topic in Scan and Paintbar Help/Discussion
I will have to think about how to do that. Thanks for the suggestion. -
Mix timeframe in formula
Mike Medved replied to stephane's topic in Scan and Paintbar Help/Discussion
No, not possible as it stands today. Basically it has a set of data it is working on (like a chart) and what you suggest would require two (or more) sets. -
I thought it was not streaming (updated every second is "snapshot" not streaming) because you mentioned before you were using Yahoo.
-
https://www.medvedtrader.com/trader/WebHelp/charts_axes.htm at the bottom, the Vertical Axis section. Easiest way - click and drag on the vertical axis to adjust. Right-click and choose "Dynamic" to return to normal. To add space on the right - click and drag on the horizontal axis.
-
That's good - but the source is not streaming MT only recalculates the scans when new data comes in. If new data comes in 10 times a second, that will eat up CPU. Of course, there are only a few stocks that are that liquid, so...
-
Here's the big problem with that idea: the stock data is shared among all windows in MT. That is why it is problematic to have two sources get data for the same symbol - it clashes. In the case you describe, the big port, after it creates the little port, will continue running the scans on the stocks in the little port if the little port is connected to a real time source, and any data that will come in big port will conflict with the data on the same symbol collected by the little port. But - what we *could* do is allow a button to create a portfolio or a watchlist from the results of a scan on another portfolio - manually. Then you could conceivably open a big portfolio/scan, run that preliminary scan on it, generate another portfolio from it, turn off/close the big portfolio and place whatever scan you want on the newly generated one.
-
merlin: that's a fairly intense scan - and you're running it on a lot of symbols. Can you tell me what your CPU and memory consumption is when you're running this (and with what feed?)
-
Actually, merlin, that indicator doesn't work right (yet, I guess) in MT. It is problematic because the zigzag indicator is backwards-changing. That is, if the current candle changes, the indicator may change to be different completely starting many candles back. So the weiss wave will change accordingly - not just on the last candle but on the last N candles where N can be big. Frankly, not only is it problematic to calculate (because MT really tries to calculate all indicators as state-machines), but it detracts quite a bit from its usefullness, if the indicator's overall shape may suddenly change not just for the current candle, but for the last N candles.
-
itsmadvil: note that the variables used in the code FIRST have to be defined in the top table for the advanced code. How to define these was explained in the comments in the code above: // Var Name: "BollingerBands_Top" contains Bollinger Bands(20,2).Top // Var Name: "PriceChannels_Top" contains Price Channels(20).Top // Var Name: "PriceChannels_Bottom" contains Price Channels(20).Bottom // Var Name: "BollingerBands_Bottom" contains Bollinger Bands(20,2).Bottom // Var Name: "VWAP_Line" contains VWAP (Intraday)().Line // Var Name: "PriceChannels_Center" contains Price Channels(20).Center // Var Name: "FibonacciPivots_Res1" contains Fibonacci Pivots (Intraday)(def).Res1 // Var Name: "RSI_Line" contains RSI(20,2).Line // Var Name: "CCI_Line" contains CCI(14).Line
-
TD Ameritrade datafeed does not support Crypto Currency quotes. You would need to select a source that does. Assuming that you are tracking regular stocks at the same time, create a separate portfolio for just crypto currencies. Add #BTC.USD and any other crypt currencies you want to it. . Open it in a separate portfolio window (OPEN PORTFOLIO tile on the dashboard). Set that portfolio's quote source to be one of the crypto currency sites. All are free and do not require login. For example, you can use GDAX
-
It's the same as Full Stoch, but instead of the regular EMA it uses the T3 moving average formula to smooth the final line (the signal line is still EMA smoothed though). I'm not sure what you mean about not being able to use it in a Paintbar - the "T3 Stoch" is one of the indicators available.