

Jack690
-
Posts
48 -
Joined
-
Last visited
Content Type
Profiles
Forums
Blogs
Gallery
Downloads
Events
Posts posted by Jack690
-
-
As an example for the indicators MACD (12,26,9) or PPO (12,26,9). How can I identify the cross of the 2 lines to give a buy or sell signal in a scan?
-
OK Mike, I have it. Thank you. So simple. 😂
-
I would like to make a scan for stocks where the close is higher than the SMA8. With the distinction whether the previous close is also above the SMA8 or lower than the SMA8. It is a pity that I do not know enough about the C language to bring this to a good end. That is why I would really appreciate it if someone could help me. Thanks.
A database of possible scans would also be very useful, I think. But I do not know if most members are willing to make their designs public.
-
Yes, to compare to the average value. If there is more interest, or frontloading, an increase in pps may begin.
-
Can we see the evolution of the amount of dollars processed daily in a stock? In order to compare him to the average dollar volume. Something like DDamanda does?
-
Historical data on Yahoo are totally crap these day's. I can not make usefull backfills with Yahoo for OTC tickers. Also the pages with historical data on Yahoo Finance gives all zeros. So I can no longer trust MT to scan charts. Very sad for people who doesn't have a account in the US.
-
Ok, I see that I need to clear the data before I try a google backfill.
It is not so that Yahoo always report maximum granularity of 3 digits. Look at other stocks such as AZFL - USMJ - NSAV to name a few.
-
I see this at multiple stocks. The historical data shows only 3 digits after the decimal point instead of 4. As a result, the historical chart is also completely wrong.
For example, the stock OTTV ( only the last day shows 4 digit. But tomorrow it will change also to 3 digits ).
I have the same result with Google backfill. I wonder what the cause is?
02/05/17 0,0006 0,0006 0,0005 0,0006 28 811 545
01/05/17 0,001 0,001 0,001 0,001 45 923 500
28/04/17 0,001 0,001 0,001 0,001 54 344 900
27/04/17 0,001 0,001 0,001 0,001 92 725 600
26/04/17 0,001 0,002 0,001 0,001 157 823 500
25/04/17 0,001 0,001 0,001 0,001 28 871 500
24/04/17 0,001 0,001 0,001 0,001 26 257 200
21/04/17 0,001 0,001 0,001 0,001 12 308 600
20/04/17 0,001 0,001 0,001 0,001 15 519 600
19/04/17 0,002 0,002 0,001 0,001 86 928 500
18/04/17 0,002 0,002 0,001 0,002 17 521 300
17/04/17 0,002 0,002 0,001 0,002 26 051 200
13/04/17 0,002 0,002 0,002 0,002 47 530 800
12/04/17 0,003 0,003 0,002 0,002 52 118 000
11/04/17 0,002 0,003 0,002 0,002 77 844 800
10/04/17 0,002 0,002 0,002 0,002 11 508 800
07/04/17 0,002 0,002 0,002 0,002 12 574 100
06/04/17 0,002 0,002 0,001 0,002 39 356 900
05/04/17 0,002 0,002 0,002 0,002 10 029 900
04/04/17 0,002 0,002 0,002 0,002 16 638 500
03/04/17 0,002 0,002 0,002 0,002 18 973 300
31/03/17 0,002 0,002 0,002 0,002 31 677 300
30/03/17 0,003 0,003 0,002 0,002 52 055 500
29/03/17 0,003 0,003 0,002 0,003 92 613 400
28/03/17 0,002 0,003 0,001 0,002 89 171 500
27/03/17 0,002 0,002 0,002 0,002 71 599 400
24/03/17 0,001 0,002 0,001 0,002 193 111 700
23/03/17 0,001 0,001 0,001 0,001 32 461 600
22/03/17 0,001 0,002 0,001 0,001 32 358 900
21/03/17 0,001 0,002 0,001 0,001 29 056 500
20/03/17 0,001 0,002 0,001 0,001 24 434 200
17/03/17 0,001 0,001 0,001 0,001 46 027 800
16/03/17 0,001 0,002 0,001 0,001 108 027 500
15/03/17 0,002 0,002 0,001 0,001 77 507 100
14/03/17 0,001 0,002 0,001 0,002 28 015 200
13/03/17 0,002 0,002 0,001 0,001 20 618 100
10/03/17 0,001 0,002 0,001 0,001 9 489 100
09/03/17 0,001 0,001 0,001 0,001 7 989 500
-
Thanks for checking. I probably should have more patience.

-
Just send you the log. I think my news settings are ok.
-
Yesterday I received news from Yahoo. Today nothing. It seems that they have changed something again.
-
Thank you Jerry for the quick answer.
-
I recieve no Yahoo news anymore. It is checked in settings / data source / news. When I check Google it works fine for Google but not for Yahoo. I restored a backup from a few day's ago when news was working. But it did not help to solve my problem.
-
Thanks for the clarification.
-
I wonder if it is possible to change the color of a row in the portfolio when a paintbar gives a alert?
For example there are 500 stocks in a portfolio. In the hystorical charts I put a paintbar that gives me a alarm when a golden cross take place.
(MA50 cross the MA200 to the upside). If the row color in the portfolio change, I can see wich stocks have a MA cross without opening all the charts.
-
Send email.
-
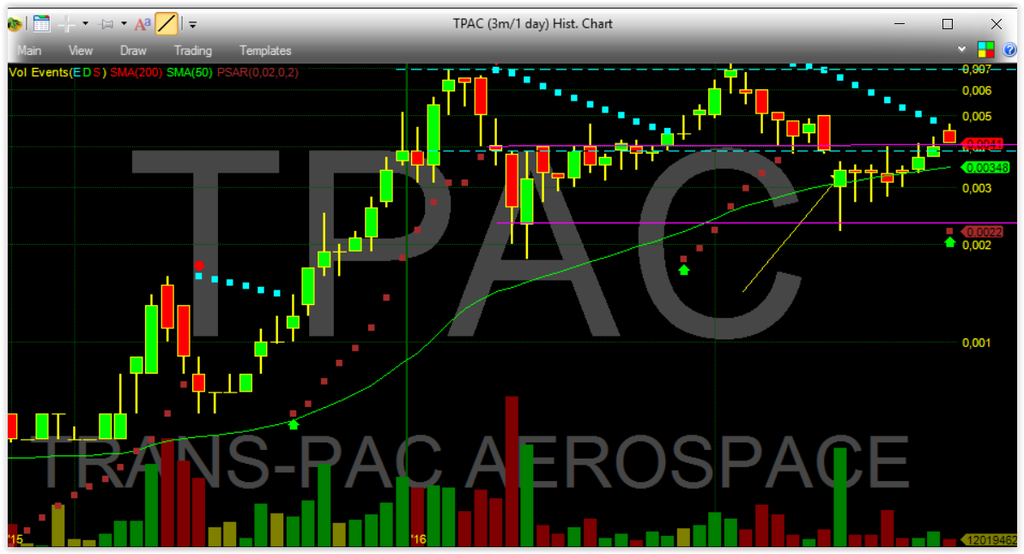
In MT the parsar was at 0.0046 when it was broken and flipped to 0.0022. On stockCharts the parsar is at 0.0065 and will not be broken in a long time. It has nothing to do with minute difference. I speak of the last candle.
-
OK, I'll do that. Thank you.
-
The chart from ticker TPAC on MT looks like this:
The chart from stockcharts.com for the ticker TPAC looks like this:
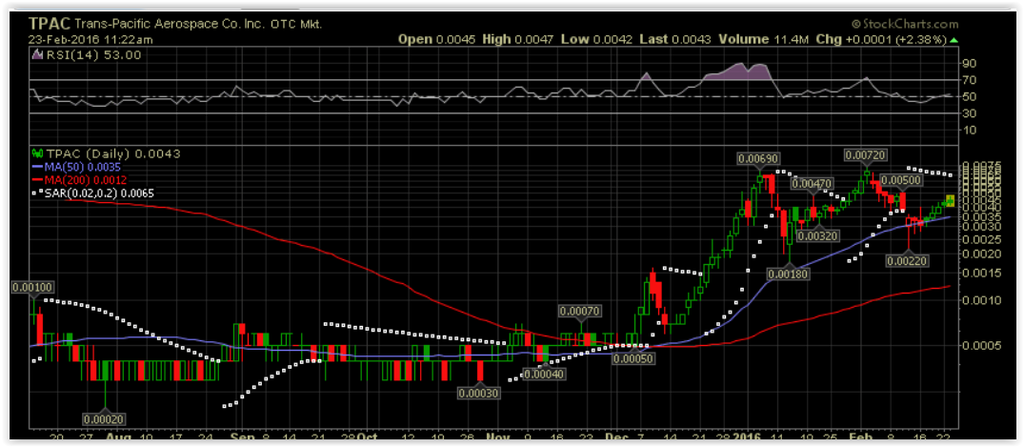
The site stockcharts.com is very reliable, but I see a different positioning of the parsar in MT and StockCharts. Both are SAR(0.02,0.2)
How is this possible? -
stock scan sometimes stops scanning. I have to shutdown and restart MT to get the scan working again. It does not happen every day, but sometimes.
Freq is set to 300 and timeframe to Us equity markets.
I can see that as the raw data not changed anymore. I am connected to Yahoo, delayed quotes.
am I doing something wrong?
-
Jerry, After the update I get again a alarm on de chart link in the trendline alarm window. When I click the link then a comprehensive text appears on the screen with errors in it that I can not copy. But there is no chart displayed.
-
Thanks. Looks good now.
-
btw, I know what went wrong in setting the log level at 200. I typed 200 in the field instead of using the pulldown menu.

-
Ok, I turned off the HTML option and push the refresh on the portfolio. Nothing changed.
I will see tomorrow what gives, but earlier this week it gave problems without the HTML option.

Scan on MACD or PPO indicators
in Scan and Paintbar Help/Discussion
Posted
Thanks. It's working. 👍