

mb4x4
-
Posts
83 -
Joined
-
Last visited
-
Days Won
2
Content Type
Profiles
Forums
Blogs
Gallery
Downloads
Events
Posts posted by mb4x4
-
-
In other words, how can I make volume bars the same width as the candles?
-
I prefer wide chart candles so I have Max Candle Width set to 100, also have "Wider bars" enabled for the volume bars however they don't scale to the width of the chart candles. Any way around this?
Thx

-
On 12/12/2021 at 11:24 AM, fleck said:
Building a new PC with AMD CPU. What CPU 5600X 6 core, 5800X 8 core, 5900X 12 core, 5950X 16 core.
Just for reference I run an older 3900X 12c (24t) with 32GB RAM which handles MT, TDA/ToS, and 2 instances of IB Gateway without breaking a sweat. The 3900X falls in between the 5800X and 5900X as far as benchmarks are concerned.
-
-
Kinda figured that may be the case with the fees included. No worries then.
The second was just curious as to why all other columns include decimal values but the three P&Ls do not. Was further made curious because you can customize Date and Numeric formats to your liking in the General settings, but they don't change these. You're correct though doesn't really matter overall.
Thanks
-
Hi guys,This Paid column looks to be the cost basis for the current position including broker fees. Is there data for another column which is the AvgCost of the actual entry/fill prices, excluding fees? The problem is broker fees vary, sometimes significantly, depending on route/share size etc. and I target entries and exits by exact price levels. It's a bit confusing sometimes hitting the Ask at an exact price, or setting a limit order, but seeing the Paid column show an unexpected price because of fees.Also is it possible to show the P&L columns with whole/decimal values as opposed to rounded whole?Thanks in advance
-
-
-
-
-
Ok good to know. Thanks!
-
Hi guys,
Assuming additional halt data is exposed via data source APIs such as Halt Reason/Imbalance Vol/Imbalance Price, would it be possible to display that somewhere on Level 2? Maybe this can be added as a very thin Panel option? These values are very active during halts as orders queue up, can be extremely helpful in determining if resumption will be bearish/bullish.
Thanks


-
A bit more digging, it appears Sterling Trader Pro which is what I used before DAS, also centers its fill markers which explains why I'm so familiar with that look. Yes it's a small thing but for visual people like myself it can make a big difference in "flow state" trading. I know quite a few traders looking to ditch their expensive brokers (using DAS/Sterling) so I think this will be a common request at some point. Would be great to at least have the option.
Thanks
Not my screenshot... just a Sterling example.

-
Yes, good point. Having them at exact locations on the X axis does give more precise info on trade. For some reason it's just throwing me off, I figured after a couple of months of MT I'd have adjusted. Would it be possible to implement a "centered" option in settings (turned OFF by default) for those familiar with centered markers? If not that's fine, it'll just take more time.
Thanks

-
P.s... I used DAS for years and no other platform could convince me to leave, until MT. Great job guys.
-
 1
1
-
-
Thanks Mike. I'm a recent MT convert coming over from DAS Trader which centers fill arrows so I guess it's throwing me off more than I would have thought. I do think having them centered keeps charts much cleaner but I guess I'm alone in that thinking if no one has mentioned it hah.
Thanks


-
Hey guys,
Any way to make the fill arrows centered on intraday candlesticks? They're all over the place, often just floating out in space. I've check all the settings, am I missing something?
Thanks


-
Didn't know that existed, and yep exactly what I needed! Thanks
-
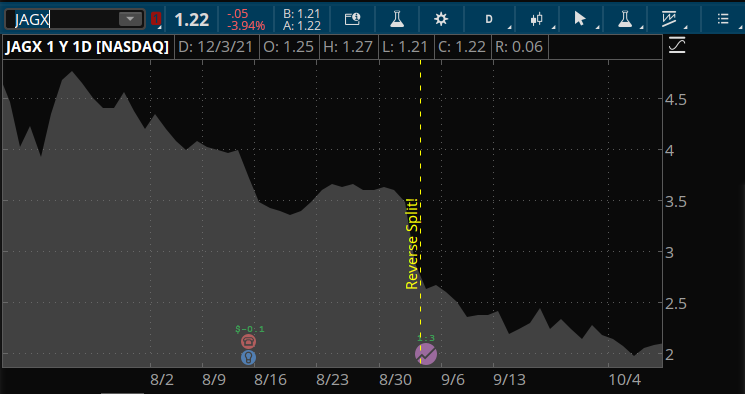
Hey guys,
Would it be possible to get a split indicator for historical charts? For example using thinkscript you can add a GetSplitDenominator variable to ToS which adds vertical lines on the daily wherever splits took place. It would be a bonus to have the split ratio included too (1:3, 3:1, etc). This is SUPER helpful for small caps that are always propping up their stock prices with reverse splits.
Thanks
Couple of examples...

-
Perfect! LULD updating now. Thank you
-
Ah OK thanks for the info.
For now I'm using two separate Level 2 windows, top is QM data (for tick-by-tick L1 data/LULD) and bottom is TDA data for L2 depth. The only issue with this setup is the LULD data doesn't refresh automatically so I have to manually click away to another ticker then back. The LULD data is correct it just doesn't update. Trading halts is my specialty so is there any way to have this update when the LULD band changes?
Thanks

-
Signed up for QM Level 1 data (NASDAQ/NYSE/AMEX) as I didn't see an option for Level 2 data. Will this be an option sometime in the future, would be great to have TotalView support?
For the time being, is it possible to have the MT Level 2 window display all of top of book depth with a Level 1 subscription? Right now the Level 2 depth is blank when using QM as the source so have to use it for backfills/portfolios/etc and TDA for Level 2 depth.
Thanks
-
OK will do, thanks Jerry.
-
Thanks. Just curious why it's happening in the first place even during regular market hours. When I pull up a new ticker the charts auto backfill but there's very often missing candles so I have to manually finish the backfill. Not sure if there's a setting I'm missing.


Trading parabolic momentum at open (using DXFeed)
in Support
Posted
Whenever a stock is going parabolic at open my data feed becomes borderline unusable, has happened a few times now. Level 1 continues to update correctly but Level 2 depth and RAW Data freezes and only starts processing the feed when volume has eased a few seconds later. It happens only at very intense volume peaks but it doesn't happen every time which makes it hard to capture/reproduce. I'm still able to place trades using IB which tells me the MT platform itself isn't freezing. This seems to have happened after switching to DXFeed but I can't be 100% sure it's related.
I've checked resources on my dedicated trading PC when this happens and it isn't being tax whatsoever, also have Google Fiber (1Gbps) so doesn't appear to be hardware/bandwidth related.
Ryzen 9 3900 (24 thread)
32GB RAM
No Antivirus etc... only trading tools.
Windows 11
Ideas? Thx