

Thebattlefront
-
Posts
75 -
Joined
-
Last visited
-
Days Won
1
Content Type
Profiles
Forums
Blogs
Gallery
Downloads
Events
Everything posted by Thebattlefront
-
The "Events" tool has a bug where, if you select "Clear All Data" for a historical chart and then backfill using any source, the Events "Earnings" and "Dividends" (and maybe "Splits", not sure) will be lost permanently.
-
Request to add "Mirror Bid/Ask" for Options Chains
Thebattlefront posted a question in Feature Requests
May seem like a small thing but, having the bid/ask in relative positions around the center column would make it more intuitive to read, similar to how the mirror button in the Level II window makes it easier to read the bid/ask for equities. Thanks for reading. The attached file is just a screenshot of how I have the options chain currently set-up. To give an idea of how it might benefit.
-
Add an Elliot Wave sequence to the chart
Thebattlefront replied to Thebattlefront's question in Feature Requests
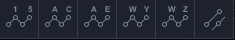
Thank you Jerry P.S. Just to clarify, the big circle dots shouldnt show between the waves either, after you use the tool it will only show the 5 numbers of the wave, and if you choose the lines. The dots are showing in that image because i have the drawing selected. -
Hello, I would like to suggest 3 sort of related things: 1) Allow user to remove the criss-cross pattern shown on extended areas of a chart when you expand area to the right of a chart. Image shown below for context. 2) Allow user to expand the chart further than 29:30 for intraday, and 100 (?) bars for daily. This one is weird because sometimes the charts lock down how far you can expand to the right (giving the user only maybe an inch or two extra), and sometimes they let you expand a lot more than that. Not sure under what circumstances the charts allow large extensions of the chart, but I've noticed intraday charts rarely allow those larger extensions when compared to the daily charts. 3) Allow the user an option as to whether they want to see the current price label on the right. The price label is usually bolded in yellow and can just barely be seen in the image.

-
Hello, I was wondering if it were possible to add an elliot wave sequence drawing tool to the chart, where upon selecting the tool you would be able to make multiple clicks of the mouse, each one corresponding to a wave in an elliot wave sequence. For example, the drawing tool "ABC" would require 3 clicks, and each click would draw the A, B, and C of the tool. The lines connecting the waves can be chosen by the user to be hidden or shown. Below is an image of what the buttons might look like and do on the chart (i have chosen to show the waves in between, although i don't like showing the lines usually).

-
Hello, I have been trying to draw a channel that is straight vertical with exactly 1 additional parallel line (3 lines total) using the channel tool, but a few issues arise when doing so. 1) You cannot use Shift + Drag to make the line be at a perfect right angle like you can with the trendline tool. This results in losing control of your drawing, and the channel remains at the same angle as when you had first clicked on the Shift key and 2) When you do get the channel tool to be vertical in nature by a very slow process of trial and error, more than 50% of the time the drawing becomes invisible. Zooming in and out causes the drawing to fade in and out of existence.
-
Quick Access Toolbar + Increase Fibonacci Expansion %s
Thebattlefront posted a question in Feature Requests
Hello, Firstly, I was wondering if we could make the Quick Access Toolbar a little bit more easy to use by allowing us to drag and drop items inside it to different positions. For example, if I were to add "Color sets" into the Quick Access Toolbar, it gets added to the very far right of the Toolbar. However, if I wanted it to be more to the left hand side of the toolbar so that it is easier to see/use, I would have to delete every other piece on the toolbar that precedes it and then re-add them to accomplish this. Secondly, I wanted to ask if we could add additional % levels for the fibonacci expansion tool (and fib retracement tool). As of now, it goes only up until 200%. Levels that I might suggest would be: 2.618 3.000 3.382 3.618 4.236 Thank you, -
Indicators with Parameters 100x normal amount
Thebattlefront replied to Thebattlefront's topic in Bug Reporting - Public
How do i delete all the settings? And i would like the old settings from August 29 if you have those too. -
Indicators with Parameters 100x normal amount
Thebattlefront replied to Thebattlefront's topic in Bug Reporting - Public
Hey Jerry, I've been getting this issue to come up again. I've tried restoring from the oldest backup, as well as deleting the quote data, but it is not working to get rid of the issue. Everytime i update MT some of my indicators / drawing tools get this 100x problem. Some of them I can go in and fix by right clicking and editing the parameter values, but others it just pops up an error (i.e. Fibonacci retracement won't let me change the messed up values). If I were to reinstall medved, is there anyway I can save my layout/chart annotation data and back it up to the new installation? How could i do that? -
Indicators with Parameters 100x normal amount
Thebattlefront replied to Thebattlefront's topic in Bug Reporting - Public
Ok the rollback worked, did the import/restore from yesterday, worked like a charm! Thank you! -
Indicators with Parameters 100x normal amount
Thebattlefront replied to Thebattlefront's topic in Bug Reporting - Public
Hi Jerry, I just updated my Medved trader to the newest version 1.1.8350, but now when I open it, none of the settings are being imported into it (it's as if medved trader was hard reset - no portfolios, no charts, no color sets are appearing when i open it. Just the Medved trader dashboard. EDIT: I did do the thing you requested in the email, about clearing the quote data. EDIT2: Actually the color sets do appear there. That's weird. But none of the charts/portfolios -
Jerry, I updated my Medved to the newest version (8275) and am having problems when it comes to adding indicators to the chart, noticeably the MACD, MA, and OBV (those were some of the only ones I tested, it seems all of them have the same problem for some reason). The Moving averages or indicator line thickness values are all 100x the normal amount (i.e. before i updated, i had a SMA(20) and SMA(50) drawn on my chart. After update, it became SMA(20) and SMA(5000) for some reason. I was able to fix that). Here's what the intraday chart looked like after update, for example, just to get a glimpse (it's normally an EMA(200)). It's 100x too large: Normally this wouldn't be an issue, but the reason this was problematic was because with the MACD, OBV indicators it wouldn't let me change the values to something smaller, it just kept popping up the same error that the technical indicator doesnt have the correct value and i should contact medved trader support to fix the issue or something. I don't know what exactly I did honestly, but the issue sorted itself out automatically. Like, i had stored layouts and when I initially clicked on them they were all messed up with the 100x value bug, but now they're all fine for some reason (working as originally intended without me changing the values back down by a factor of 100). I just wanted to bring this up in case this issue may pop back up sometime in the future.

-
So, when I went to end the MT.exe process in Task manager, it doesn't show up. There is no MT process other than "MTUpdater". I checked the entire list over, twice, to make sure there was no MT.exe. Usually its easy to spot because it has the Medved logo on it too. It's not there. When I reboot Medved Trader after closing the updater, I can see the MT process again. I sent the log file just now. It's still the older version I'm using.
-
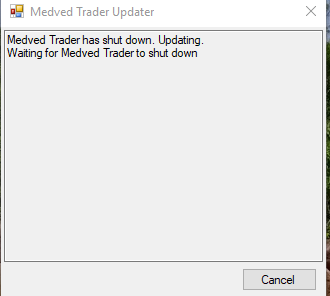
Hello, I tried updating my medved trader this morning to the latest patch, but the updater gets stuck on this screen and will not update:
-
Hi there, I was wondering if there could be an option to keep the Sub-Total label on a watchlist after all symbols have been removed from it. The reason for this is, sometimes my watchlist will not always contain a set of symbols that fit every individual label at the given time. That doesn't mean I don't want the label there, I just don't have any symbols that fit that particular label at the current time. So for example, attached is a partial screenshot of a watchlist I have on Medved Trader (medved 1). This shows four different Sub-Totals, where each is labelled based on a particular stock pattern that I scan for on a daily basis. Not everyday will there be an opportunity to have a "Bullish-divergence" stock show up, for example, but that doesn't mean I want the label to go away after I remove the symbol "GSS" from that list (GSS is no longer a Bullish-divergence play, I've just had it on there for many weeks now in order to keep the Sub-Total label active). I was just wondering, if there could be perhaps a checkbox under Application / Appearance where you can mark a box that says "Keep Sub-Totals with no symbols". Although this may present the problem of removing the Sub-Total once you don't need it anymore (as clicking on it and pressing delete does not work I do not think). Thank you for reading

-
Ahh Ok that's why it's doing that. It's been driving me crazy, I'm pretty sure this fixed it. Thank you!!
-
The stuff in the screenshot doesn't match. Look at the last closing trade for HEMP. The intraday chart shows that it was at 0.2415 (This is the bottom chart, the one before i fixed the data by backfill. This is the accrued data.) Now, if you look at Raw data table, the last trade isn't 0.2415, it's 0.24. In fact, there is no trade showing at 0.2415 at all in the Raw Data Table. The top chart is the one that is backfilled and fixed. The one on the BOTTOM is the messed up one (I swapped the pictures by accident).
-
I sent another set of log files too in case you needed them.
-
Here is another example - HEMP. Screenshot 1 after "Clear data and backfill". Screenshot 2 is before that (Sorry i swapped them by accident)


-
Oops i thought you meant just the picture of the chart. Derp. It's for every symbol I have too, not just ZN. I will do that now.
-
So, I still have the issue, was hoping it would go away with a fresh install of medved. Here's an example of what im talking about in the pictures below: The first picture is what occurs when the data flows in normally while I'm watching the trading of a security. It's the accrued data from the live feed of TD Ameritrade. It is not correct, it doesn't match the time and sales window that I have running. The second picture is when I click "Clear Data" and then "Backfill intraday data". The chart corrects itself and the data displayed is correctly. This occurs for both TD Ameritrade and Yahoo finance data. Also, medved trader on my laptop seems to work fine without issues. So I'm thinking its a problem somewhere on my medved.


-
Ok, done
-
Hello, I have been using TD Ameritrade as a data source for my trading, but the data that it is providing me on the intraday setting is incorrect. That is, I can see the Raw data time and sales being executed in another window, but the chart fails to update this accordingly. As such, the only way to get an accurate chart is to do Clear Data > Auto backfill (which then shows the correct charting). Any idea?
-
Thank you!!
-
Hey, I had a question about the Raw Data tables in Medved Trader. What does it mean when a trade is executed in the Raw Data table, but then a few minutes/hours later, that particular trade gets "slashed" (i.e. the text becomes strikethrough). I attached a screenshot example of what it looks like.


