tommyjames
-
Posts
151 -
Joined
-
Last visited
-
Days Won
1
Content Type
Profiles
Forums
Blogs
Gallery
Downloads
Events
Everything posted by tommyjames
-
Thanks 😀
-
Hi, When I use the Trade Beads on a chart it puts the beads on all charts I have open for that symbol. Then when I go to clear them it only clears them on one chart at a time. Would it be possible to make an option for when you set them it only gets applied to the chart you are putting them on? Thanks
-
Thanks
-
Hi, When you turn on "Show Fill Size for filled transactions" the buy size is difficult to see. See attached... Thanks

-
I had simular problems today with my orders (IB) not executing and then 30 seconds or so later they execute.
-
Crosshairs stuck on, on every open chart
tommyjames replied to tommyjames's topic in Bug Reporting - Public
If I hit shift for any reason when on a chart the crosshairs come up. I constantly hit shift to draw horizontal lines. When I leave go of the shift key the crosshairs stay activated on all of my charts except the one I was drawing on. Then if I move the mouse over a chart where the crosshairs are stuck on they then disappear. Then if I change symbols the crosshairs are stuck on again on random charts. The problem with it is when the crosshairs get stuck on I can't see the bar that the crosshairs are on top of, it is usually the current bar that is forming. All of the charts that I have open are on the same symbol link group and trace link group. -
Crosshairs stuck on, on every open chart
tommyjames replied to tommyjames's topic in Bug Reporting - Public
This is still happening after the update you sent. Thanks -
Crosshairs stuck on, on every open chart
tommyjames replied to tommyjames's topic in Bug Reporting - Public
I am seeing something different, as I described it above. This has never behaved this way before today. -
Crosshairs stuck on, on every open chart
tommyjames replied to tommyjames's topic in Bug Reporting - Public
They are synced but Not always on. If you hold down shift you see crosshairs on all charts. When I leave go of shift they used to turn off automatically. Now they seem to be stuck on and I have to move the cursor over each chart to get the crosshairs to turn off. Also if I change to a new symbol some of the charts have the crosshairs on automatically without me holding down shift and as soon as I put the cursor over the chart it disappears. -
After updating to the latest beta this morning crosshairs will not automatically disappear like usual. You have to put the cursor over every chart to make the crosshairs disappear. Thanks
-
It's already excluded from the security software. I'm not using either of those alerts. Is there a way to see what version I was on previously?
-
Hi, I installed the latest beta this morning and now MT is using over 40% CPU constantly. I haven't changed anything on my end. I restarted multiple times with the same behavior. Thanks
-
Click and drag on top of the date/time just above the lower scroll bar
-
It's actually more difficult to select now but I see why. To select the tool you have to click the exact corner of the tool, clicking the line doesn't select it. If you do have the text on you are able to click on the text and drag the tool around, you can't do that with the text off. I think having solid lines that you can click anywhere on to select it would be helpful. Thanks for your work on this, it really helps in sizing positions.
-
Once the tool is on the chart, trying to click on it to adjust it is very difficult. I find myself clicking on it multiple times to select it. I think addressing (1) and (2) above will help (3).
-
Hi, Would it be possible to add the following options to the Risk/Reward tool... 1. The ability to "Always Hide the Text" 2. Have solid lines that the width is adjustable for the entry and stop 3. Have the anchor points easily accessible Thanks so much!
-
Feedback from using the Risk/Reward tool with hotkeys.
tommyjames replied to alv123's question in Feature Requests
Also having a hotkey to quickly clear the selected prices would be useful. -
3. When you hit a hotkey to create a trade Using XonChart fixed it
-
Feedback from using the Risk/Reward tool with hotkeys.
tommyjames replied to alv123's question in Feature Requests
Also it is remembering bead prices from other symbols, see attached...
-
Feedback from using the Risk/Reward tool with hotkeys.
tommyjames replied to alv123's question in Feature Requests
Maybe having the beads overlap the price scale would simplify the chart...
-
Thanks
-
Would it be possible to add an option to force the trade capsules to be on the far left of the chart? The capsules are always blocking price and I have to drag them to the left on every chart. Thanks
-
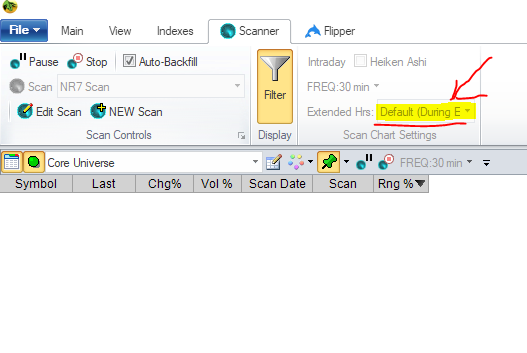
I have the default set to "During Extended Hours" because I want to see the pre-market data during pre-market, then at 9:30 it doesn't show the pre-market data anymore, which is how I want it. I don't run a scan until 10am. So when I run a scan it shouldn't be pulling any data from pre-market (which it isn't). Now between 10am to 11:30am when I am running this scan on a 30 minute chart it doesn't find any NR7s unless I change Extended Hrs: to "Current Day" (which I don't want). If I put it on the chart as a paintbar it does not show NR7s during the first few hours of the day, but at the end of the day it will then show the ones that it was supposed to be showing from the morning.
-
I have the default set to "During Extended Hours". I only changed it to "Current Day" to see if it would work. I don't want it to look at the data from extended hours if possible but that's the only way it will work right now. It seems like by setting it to "Current Day" it then has enough bars from pre-market to do the calculation.
-
It will only detect it during the beginning of the day if you select "Show Extended Hours". I'm guessing it's looking for 7 bars during the current day for some reason. It does this on a chart and in a scan.